|
I love my animal project (original post found here) but I have been wanting to incorporate more technology. I have shied away from Desmos and like products because domain/range restriction is needed to create a picture...
Then I realized that my Algebra I students learn how to graph piecewise functions. A match made in math heaven. Students were asked to create any picture they wanted (I also encouraged them to explore functions that have not been covered in class) using functions covered in class (linear, constant, and absolute value) and make a picture by restricting the domain. To submit, they e-mailed (before the class of the quiz) their creation to me and I printed it off. This picture counted as 20 points on their piecewise functions quiz. I created a simple rubric that is attached on the file below. I like giving students the opportunity to earn quiz points outside of class. Alternate assessment anyone? Instructions (steps 1-3 were completed in class, they started 4 in class but had time at home to finish): 1st: Create an account at Desmos. Feel free to play around on the calculator that shows up for a minute or two. 2nd: Watch entire video (it’s under 5 minutes) by Bob Lochel from mathcoachblog.com to learn how to resist domain, change the color of the graphs, and enter piecewise functions. Watch this Video 3rd: Think about what you want your picture to be and then create! Refer to the rubric below for how you will be graded. I have included an example of a similar project that I completed a few years back on a similar program. If you would like to explore with different functions that we have not covered in class, feel free to! 4th: When your creation is complete share the graph with me (included my e-mail and such) The students enjoyed this and I had a great experience using Desmos. Reflections: 1) Will use again 2) Will provided more guidance on what to draw (school spirit, holiday theme, etc...) 3) Maybe add color in there some where?!?! That just takes more time though. It would be interesting for older students that have more functions in their tool belt. Check out my TPT store to purchase this item.
2 Comments
In February I attended the Designing Making Experiences Conference held at the Castilleja School's Bourn Idea Lab in Palo Alto, CA. It was a crazy week for me personally, I got engaged the weekend before and was busy updating resumes for my move to Nashville and starting to plan a wedding so I was concerned that I would not get the full experience. I was wrong about that! The conference gave my math department chair at Marist and me the opportunity to see a maker space lab in all its glory. I was foreign to the idea but soon became excited about the idea of having a space allowing kids to create. A maker space is like the 21st century "shop class" and is filled with power tools, 3D printers, arts and crafts supplies, and other items that let students create. What students create can be tied to a particular standard in an academic class or just a random thing. During the conference, we created as well! Each participant was also expected to create a project that could be brought back to their school. I had a hard time thinking of something that I could use. The first produced nothing and I was frustrated. However, after racking my brain and thinking of the topics I was covering and piecing together what I have seen other teacher's do online and in-person, I adapted a probability carnival project from Tom DeRosa. The overview is that the students (in pairs) design a unique carnival game that involves probability. The students must be able to find the theoretical probability (this was a struggle for some who wanted to add in elements that involve skill such as make a basket). Make sure to stress to students not to make it too complicated. To collect the experimental probability, we threw a carnival. I invited parents and the entire school to come play the games. It was a blast! We had tons of classes, teachers, parents, and administrators stop by to play games and win prizes. My students loved it. After the carnival, the students had to complete a write-up which included a probability analysis comparing their theoretical and experimental probability. The part I will change for future years is the write-up. They were not as detailed as I would of like and I will provide more direction in the future. This has been one of my favorite projects since the whole school community got involved. Now I just need to grade...
 I love it when what is going on in life is relevant to what I am teaching. I am getting married this summer and am finding out just how expensive weddings are. Every site and article I read always seem to state the average cost of a wedding, however, I know from all the statistics classes I have taken that the mean is not always the best way to represent the typical value. My Advanced Pre-Algebra students are currently learning about the limits of basic statistics and the cost of a wedding in the United States is the perfect tie in for the debate of mean vs. median and the impact of outliers. On the quiz I gave my students Monday, I asked them the following... 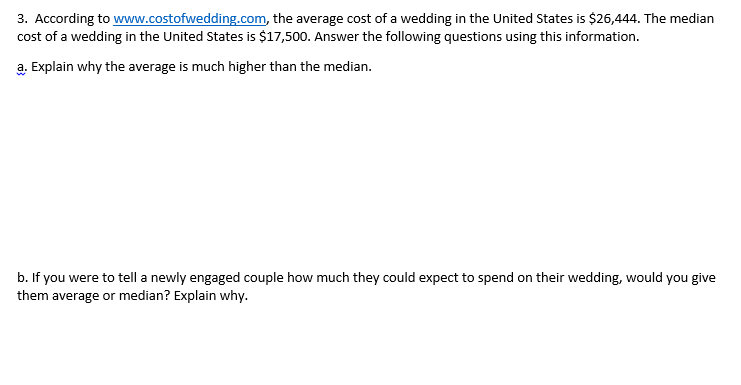 In part (a) I was looking for the use of the vocabulary of outlier and mentioning that there were expensive weddings that were bringing up the mean but not effecting the median. In part (b) I was looking for the students suggesting that the newly engaged couple be told the median since that value is not as influenced by the high outliers like the mean is. Below are some shots of my student's explanations. 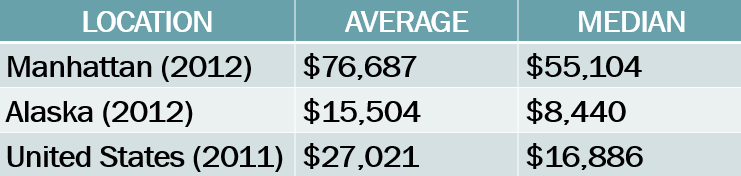 Before I returned graded quizzes, I had my students read Will Oremus' article: The Wedding Industry's Pricey Little Secret. Mr. Oremus does a great explaining that the averages are more than what most couples spend. He continues to point out that the sources who provided the public with the average (TheKnot.com, New York Post, etc...) typically exclude the poorest and most low-key couples from their samples simply because those couples are not on those sites or responding to the surveys. I especially enjoyed this section: 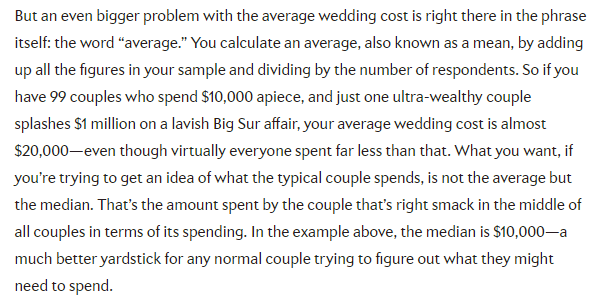 Oremus goes on to explain why the median is not used as the statistic: Americans do not understand what the median is. TheKnot .com told Oremus that is does not publish the median along with the mean since they don't want to "confuse" people. When Oreums asked the editor in chief of TheKnot.com to expand more on why the median is not used, this was her response: 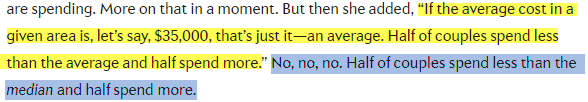 She did not understand what the average was. Her reasoning is the typical error of most people-that the average tells you 50/50. The average serves as the balance of data, and not (usually) the indicator of the middle. That's the median. We had a great discussion as a class after they read they article. Thank you Will Oremus for a fantastic article that got my students talking about statistics and providing me some insight as I plan my wedding. Readers, I leave you with the closing remarks of Mr. Oremus: "There's nothing wrong with spending 28 G's in 24 hours if you've got the means. Just don't fool yourself into thinking that there's anything average about it" (emphasis added) (The file below is the word document I made from the article to print nicely. I printed 2 pages to 1, double sided.)
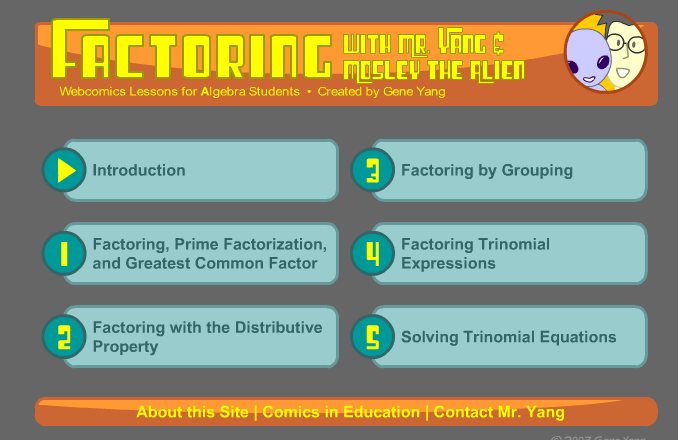 Factoring quadratics is an important concept in math and is sometimes not the most exciting concept to teach. When I was teaching in Memphis, my students were reading American Born Chinese by Gene Yang and I was directed to his online comic that was dedicated to factoring. The idea of incorporating festered in my mind for few years and I last year I decided to incorporate the comic into my unit on factoring. I would encourage you to explore Factoring with Mr. Yang for a few minutes before reading the rest. I give my students guided reading-I am attaching the condensed file below. The night before we start the unit (I did give this after they finished the test before it...I may change that this year) I had my students click through tabs: Introduction, 1, and 2 while completing the worksheet. The next night they complete lesson 3 and the following night lesson 4. My students did enjoy the activity. I mean, it makes factoring more interesting and your teacher is asking you to read a comic for homework.
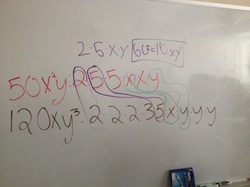 I enjoy using group activities for students to review concepts. This particular activity has 3 different group options each dealing with finding the GCF of two binomials; 1st: Explain only using words how to find the GCF, 2nd: Use only picture/symbols to find the GCF, 3rd: Act out a scene (more descriptions below). I wish I could remember what website I found this activity but for the life of me I cannot. I break the students into groups and set a timer for 10 minutes. Then each group presents. This whole activity takes roughly 20 minutes from start to finish. I used this particular activity during a review day before a test. My favorite part of this and especially for my thespians in class: Act out this scene: The monomial 50x^2y and 120xy^3 want to get married. 50x^2y's mom thinks that her daughter has nothing in common with that crazy boy, number 120xy^3. They all go on Oprah/Dr. Phil/Ellen to work it out. The wise Dr. Numbers will be there to help. You will be given 10 minutes to rehearse your scene and then the group will present to the class. Characters: Mon, daughter, crazy boy, and Dr. Numbers The acting scene is so fun! I provide that group with blank sheets of paper with tape to name character name cards. I wish I had saved the video...
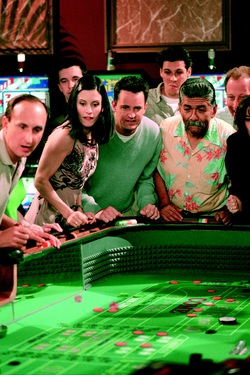 Probability is one of the most interesting topics to teach but it also can be controversial. A number of the hands-on activities associated with probability are 'games of chance' (aka casino games/gambling) and have to be presented in a different way. A favorite in the probability world is calculating the chance of rolling a certain sum with 2 dice (or number cubes- the PC way to say dice). I have always use the game Beano for this purpose but while enjoying Friends one evening Monica and Chandler provided another illustration while playing craps in Vegas. Now, I would never use this example unless my audience was out-of-high school since it involves gambling and deciding to get married based on the sum of two dice. But is does provide an opportunity to discuss what is the probability that Monica rolls a sum of 8 (5/36) or a 'hard' 8 (rolling 2 fours- 1/36). The clip from the episode is below. Enjoy. And in the words of Monica Geller, "It just got interesting."
 I spend the class before a test reviewing. This can be a very useful day for students or a complete waste of time where nothing is accomplished. I have found that providing a VERY structured class helps students more than just saying: "Work on your study guide for class." I try to switch activities at least every 15 minutes to keep it from getting stale. Below you will find two different layouts I use to review. The document/files attached are in relation to the first method described. Example of a review day in class (The PowerPoint is in reference to this layout): 0:00-0:10 Take a 7 minute time trial and take 3 minutes for checking and questions (Kuta has some great resources) 0:10-0:17 Return recent quiz/homework and take 7 minutes to go over (loving my document camera for this!) 0:17-0:18 Stretch break (hope they enjoy the cartoon clips I found) 0:18-0:23 "I have..., who has..." vocabulary game. (See file attached below) 0:23-0:33 Take 10 minutes to go over questions from the study guide as a class (I set a timer to keep this to 10 minutes) 0:33-0:43 4 Corner Activity to go over a concept that students typically struggle with 0:43-0:55 Free study time (work with a partner, finish your study guide, ask Ms. Turbiville a question, etc...) Another example of a review day in class: 0:00-0:10 Work on your study guide individually with no notes. Highlight problems that you are having trouble with. You may not ask Ms. Turbiville questions. 0:10-0:20 Work on your study guide individually with your notes/book. Make a strong attempt to answer the questions you highlighted. You may not ask Ms. Turbiville. (I want them to learn to relay on what they know so I do not allow students to ask me questions for the first 20 minutes) Solution keys will be posted on the board and they may refer to those. 0:20-0:35 You may work with a partner and ask Ms. Turbiville questions. 0:35-0:55 We go over questions as a class. At the end, I do allow students to take pictures of the solution key.
 Zero. What an interesting concept. I have mentioned that I have used an article in class to introduce even, odd, or neither even or odd function and it turned out well. Just google "zero even odd hurricane sandy" and you will come across articles with comments made that show full on arguments if zero is even of odd. I find that students may have difficult distinguishing between the difference between zero and none. For example, with my Algebra I students we covered x-and y-intercepts and some found it difficult to write "none" instead of zero when identifying the y-intercept for an equation like x = 5. Below are great videos that explore zero and one (another good topic) a little bit further. This, I admit, is a rambling post but love these resources! I am starting to use TED Talks in some of my classes. TED-Ed has fabulous lessons that I would recommend checking out. |
Natalie Turbiville
Educator who loves math and working with students. Archives
May 2016
Categories
All
|
||||||||||||||||||||||||||
 RSS Feed
